
Rates of adverse vaccine reactions
Part of the work of health professionals and regulatory officials in immunization programmes is to:
- Anticipate and/or evaluate AEFIs associated with specific vaccines,
- Compare reported AEFIs in their own jurisdictions with 'expected' adverse events in vaccinated and unvaccinated individuals,
- Facilitate the investigation and response to serious AEFIs.
However, one of the main challenges in surveillance of AEFIs is to differentiate coincidental events from events that are caused by a raction to a vaccine or its components.
To help strengthen the capacity to introduce vaccines in Member States, WHO has published WHO Information Sheets on Observed Rates of Vaccine Reactions online to provide details on selected vaccines that are relevant to the analysis of reported events. These cover, for example, vaccines such as Anthrax, BCG, Hep A, Hep B, Hib, HPV, Influenza, Pneumococcal, Rabies, Varicella Zoster.
Key point
Observing the rate of an adverse event in the vaccinated population and comparing it with the rate of this event among the unvaccinated population can help to distinguish genuine vaccine reactions.
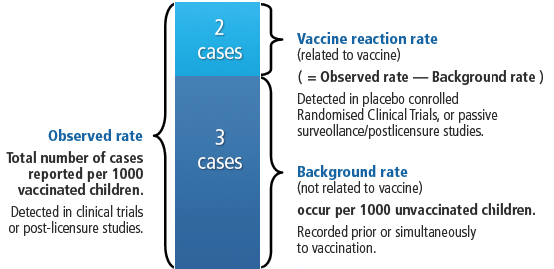
The following graphic shows, how comparing the background rate with the observed rate of an event can help to determine the vaccine reaction rate (i.e. the rate of events that are actually caused by the vaccine).
| Terminology | How is this measured | Example |
|---|---|---|
| Background rate | Background rates can be determined in a population prior to the introduction of a new vaccine or simultaneously in non-vaccinated people. | If we measured the temperatures of a population of 1,000 unvaccinated children during one week, some children would present a fever (defined as >38°C) during the time of observation (e.g., infections). For example, a rate of 2 cases of fever per 1,000 children per week. |
| Observed (reported) rate | The observed rate can be measured in pre-licensure clinical trials or post-licensure studies. | If we observe the same population of 1,000 children but we now vaccinate all children and measure their temperatures daily there will be greater rate of fever. Thus, the rate of fever may increase to 5/1,000 children per week, with the increase concentrated in the 72 hours that follow vaccination. |
| Vaccine reaction rate (attributable rate) | Randomised clinical trials which are placebo controlled. Post-licensure studies – passive surveillance. |
Thus, the vaccine attributable rate of fever will be 3/1,000 vaccinated children (that is the observed rate minus the background rate). |
Comparing observed with "expected" rates of adverse events
If the background rate of a particular adverse event is not known in a community (as is often the case), you will need to compare the observed rate in your population with the 'expected rate' published by the vaccine regulatory authorities. For example, this information, from WHO, shows the expected rates of AEFIs following some childhood vaccines:
Expected rates of AEFIs following some childhood vaccines
| Vaccine | Estimated rate of severe reactions |
|---|---|
| BCG | 1 in 1,000 to 1 in 50,000 doses |
| OPV (oral polio vaccine) | 1 in 2–3 million doses (or 1 in 750,000 doses for the first dose) |
| Measles | 1 in 1 million doses |
| DTP | 1 in 750,000 doses |
Question
Imagine that rumours begin to circulate about a vaccine when cases of convulsions following immunization occur amongst vaccinated infants. The background rate of convulsions in this population is 1:1,000 infants. The observed rate in vaccinated infants is 1.2:1,000. What is the vaccine attributable rate derived from these figures?
| A. 2 additional cases of convulsions in every 1,000 vaccinations, compared with the background rate. | |
| B. 2 additional cases in every 10,000 vaccinations, compared with the background rate. | |
| C. 1.2 additional cases in every 1,000 vaccinations, compared with the background rate. | |
| D. 1.2 additional cases in every 10,000 vaccinations, compared with the background rate. |
Answer B is correct.
- The vaccine attributable rate is 0.2:1,000 or 2 additional cases of convulsions in infants in every 10,000 vaccinations, compared with the background rate.
Other factors to consider when comparing rates of AEFIs
Keep in mind the other confounding factors that may influence the comparison of rates of adverse events.
A confounding factor is anything that is coincidentally associated with an event (in this case, an AEFI), which may mislead the investigator into wrongly concluding that the factor is influencing the rate of an adverse vaccine reaction. Here are some factors to consider when comparing one observed AEFI rate with another. Click on each factor to see how it may confound the results of the AEFI investigation.
Although a vaccine may have the same antigens, different manufacturers may produce vaccines (or 'lots' of the same vaccine) that differ substantially in their composition, including the presence of an adjuvant or other components. These variations result in vaccines with different reactogenicity (the ability to cause vaccine reactions), which in turn affects the comparison of their vaccine attributable rates.
The same vaccine given to different age groups may result in different vaccine-attributable rates. For example, MMR vaccine given to infants may cause febrile convulsions. This symptom does, however, not occur in adolescents who are given the same vaccine.
The same vaccine given as a 'primary dose' may have a different reactogenicity profile than when it is given as a 'booster dose'. For example, the DTaP vaccine given as a primary dose is less likely to result in extensive limb swelling when compared with this same vaccine given as a booster dose.
Adverse event may be defined differently in research studies that do not stick to the same case definition. Not using standardized case definitions may consequently affect the estimation of the AEFI rate.
The way that surveillance data is collected may alter the rate. For example, surveillance data may be collected actively or passively, using pre- or post-licensure clinical trials, with or without randomization and placebo controls.
The background rate of certain events may differ between communities. This can influence the observed rate even though the vaccine attributable rate is the same in both communities. For example, reports of death post-vaccination may be higher in a country that has a higher background rate of deaths due to coincidental infection.